Fermentation tab
Track fermentation with readings or a connected hydrometer, see the gravity chart with plan, targets and FG projection, record the final gravity, close the spunding valve on time, plan carbonation and follow conditioning.
The Fermentation tab follows the beer from pitching to packaging. It shows the current gravity and how far fermentation has come, a chart of all readings against the plan, what is due next, and the carbonation plan. While the brew is conditioning it also counts down the conditioning days.
Current state
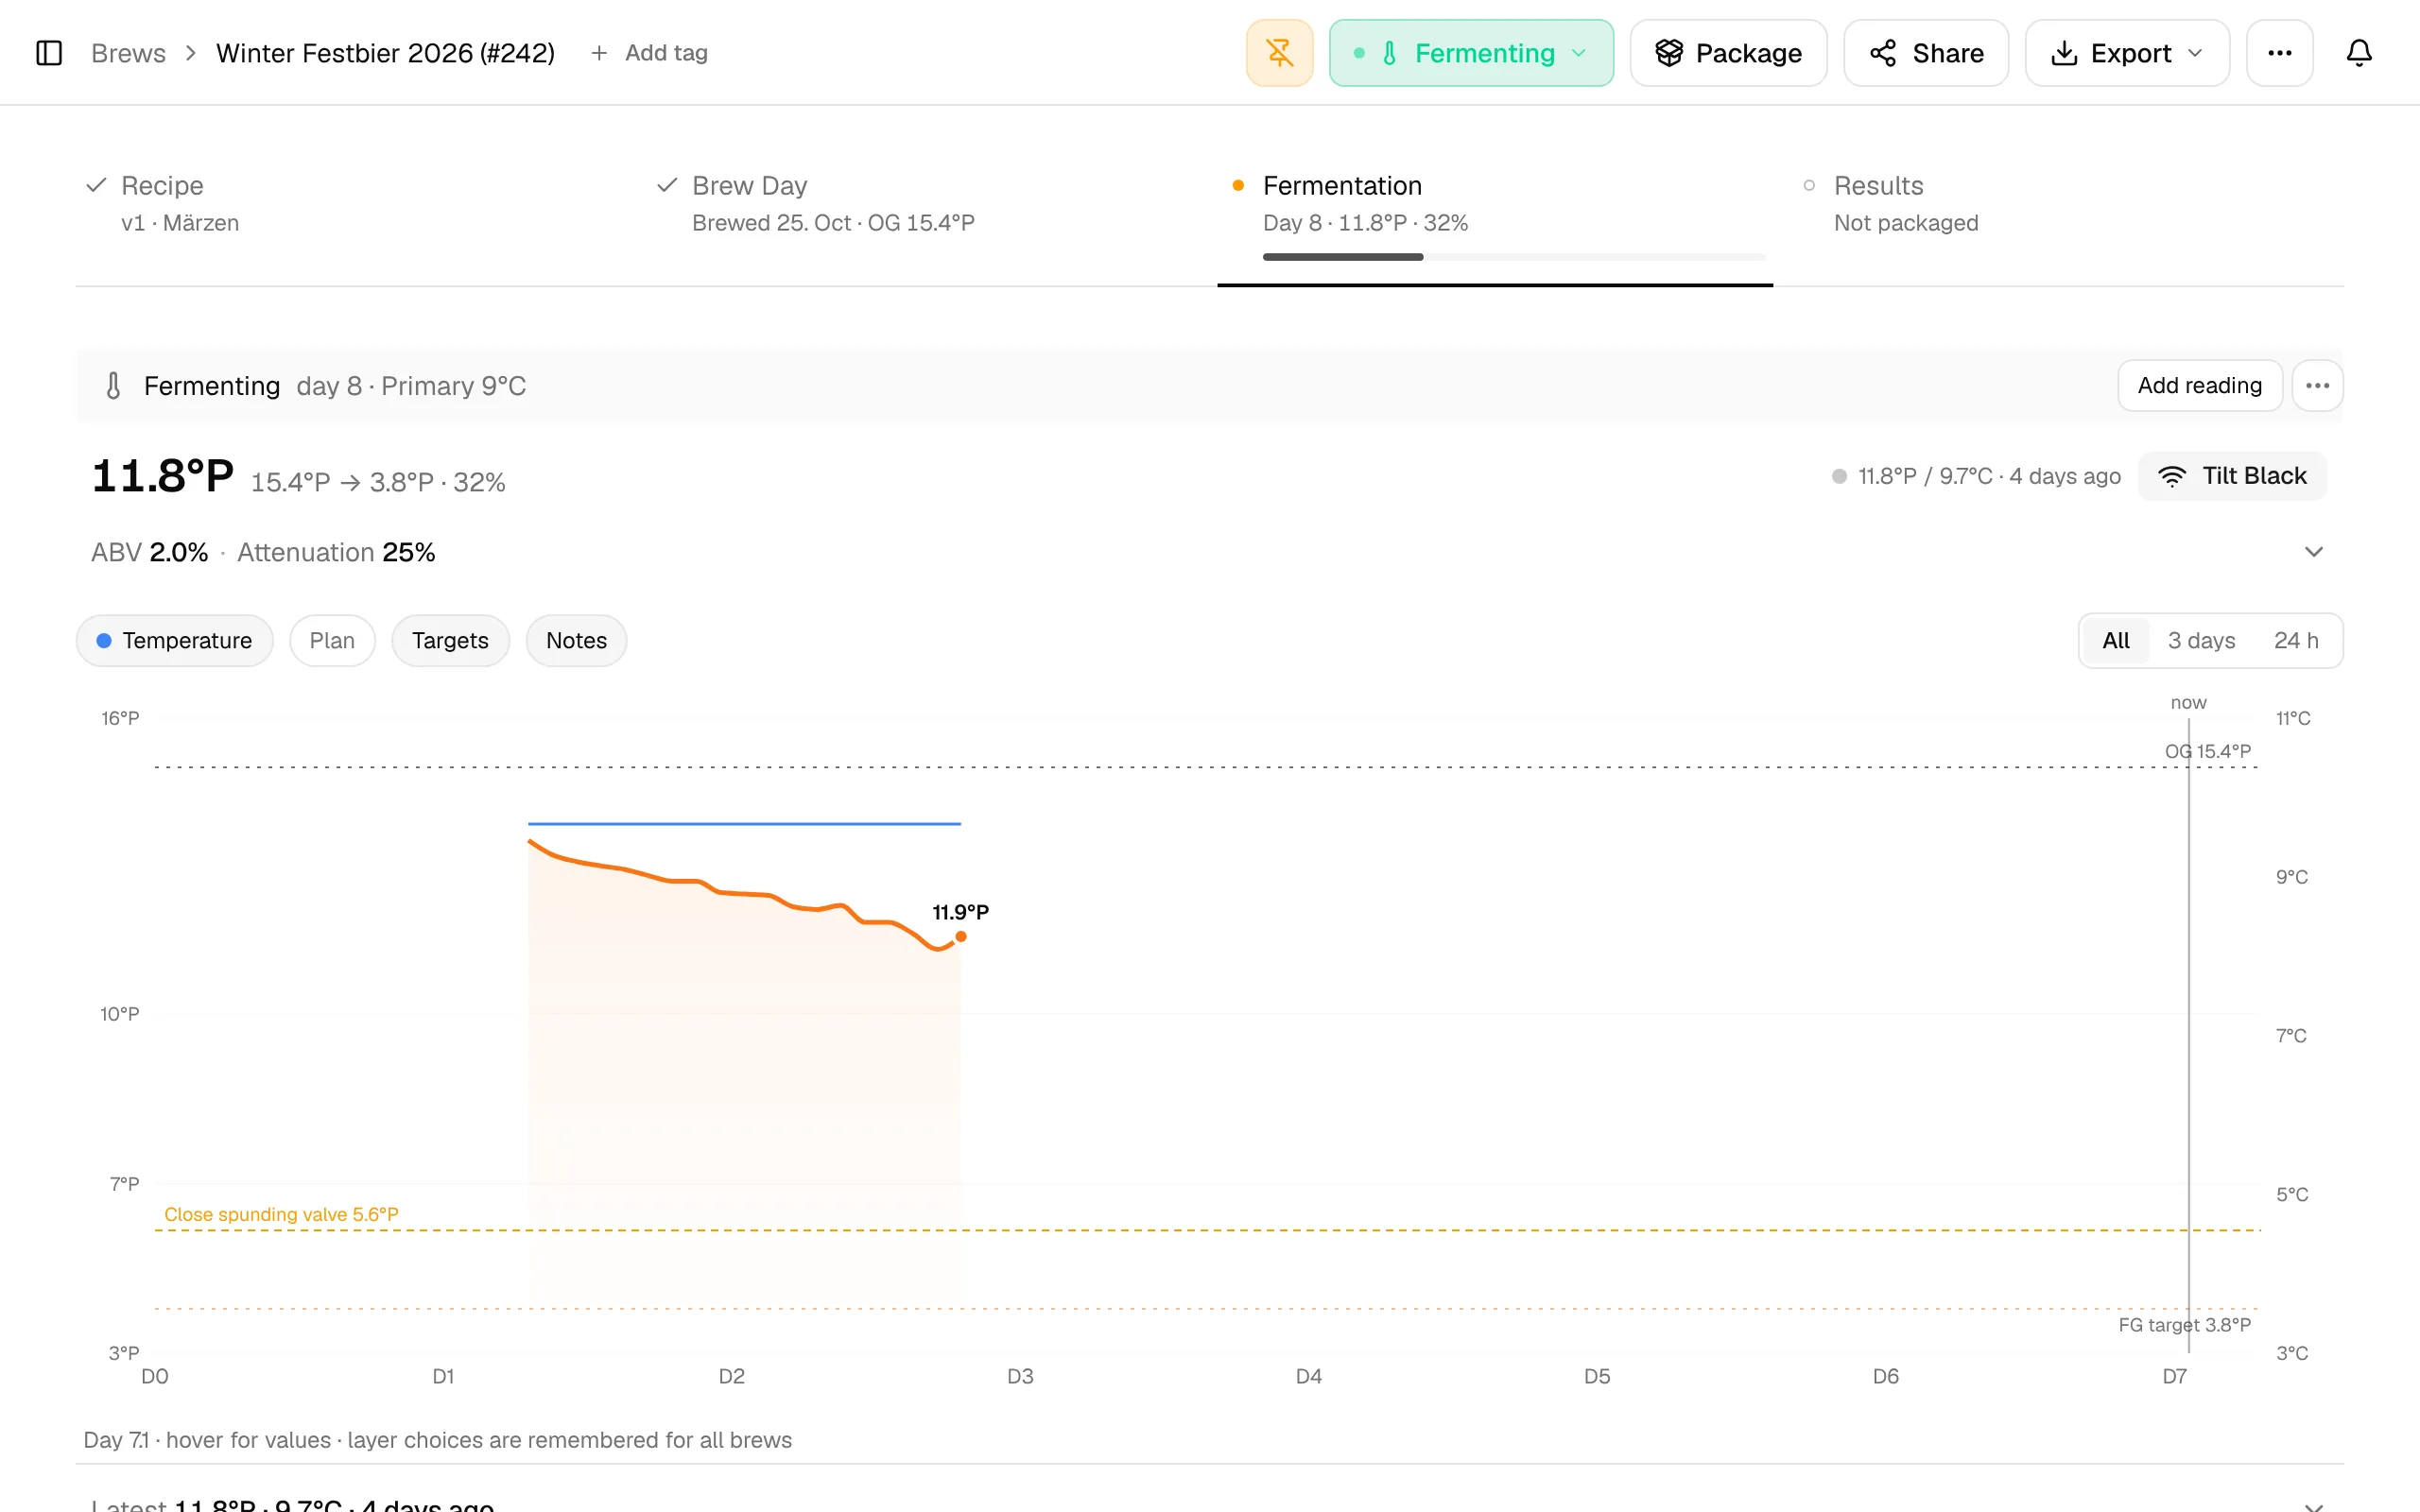
The section bar says Fermenting with the fermentation day and the current stage of your fermentation schedule, for example "day 8 · Primary 9°C". Day 1 starts on the brew date.
Below it, the large number is the current gravity: the recorded final gravity, or else the latest reading. Next to it you see OG → target FG · progress. Without readings it says what you pitched at and which FG is planned.
progress = (OG − current gravity) / (OG − target FG) × 100, limited to 0–100 %
Example: OG 1.062, current 1.046, target FG 1.015 → 16 / 47 = 34 %. Once you record the FG, progress is 100 %.
The target FG comes from the recipe, recalculated with your measured OG (or your FG override).
Next to ABV and Attenuation you see the fermentation speed. Click the line to see more: Status (Active or Stable (24 h)), Speed now, Peak speed, Peak Temp, Duration of your readings, the estimated date the FG is reached, the Target CO₂ and the spunding pressure.
Readings
There are two ways to get readings in:
- Connect device: the button next to the section title opens Devices for this brew. Pick one of your devices (iSpindel, Tilt, RAPT Pill, GravityMon, Hydrom, BrewBrain Float, Plaato Airlock or a custom stream) and click Connect; its readings land on this brew from now on. You can connect several devices, and the button then shows the device's name or how many are connected. Next to it you see the device's latest values; the dot is green when it sent data in the last 30 minutes, grey when earlier, and pulsing amber while it is Waiting for the first reading. Disconnect in the same dialog frees the device for another brew. Details: Fermentation tracking.
- Add reading: enter a reading by hand. Only the time is required; Gravity, Temperature, pH, Pressure and a Comment are optional, so you can also log just a note or a pH value.
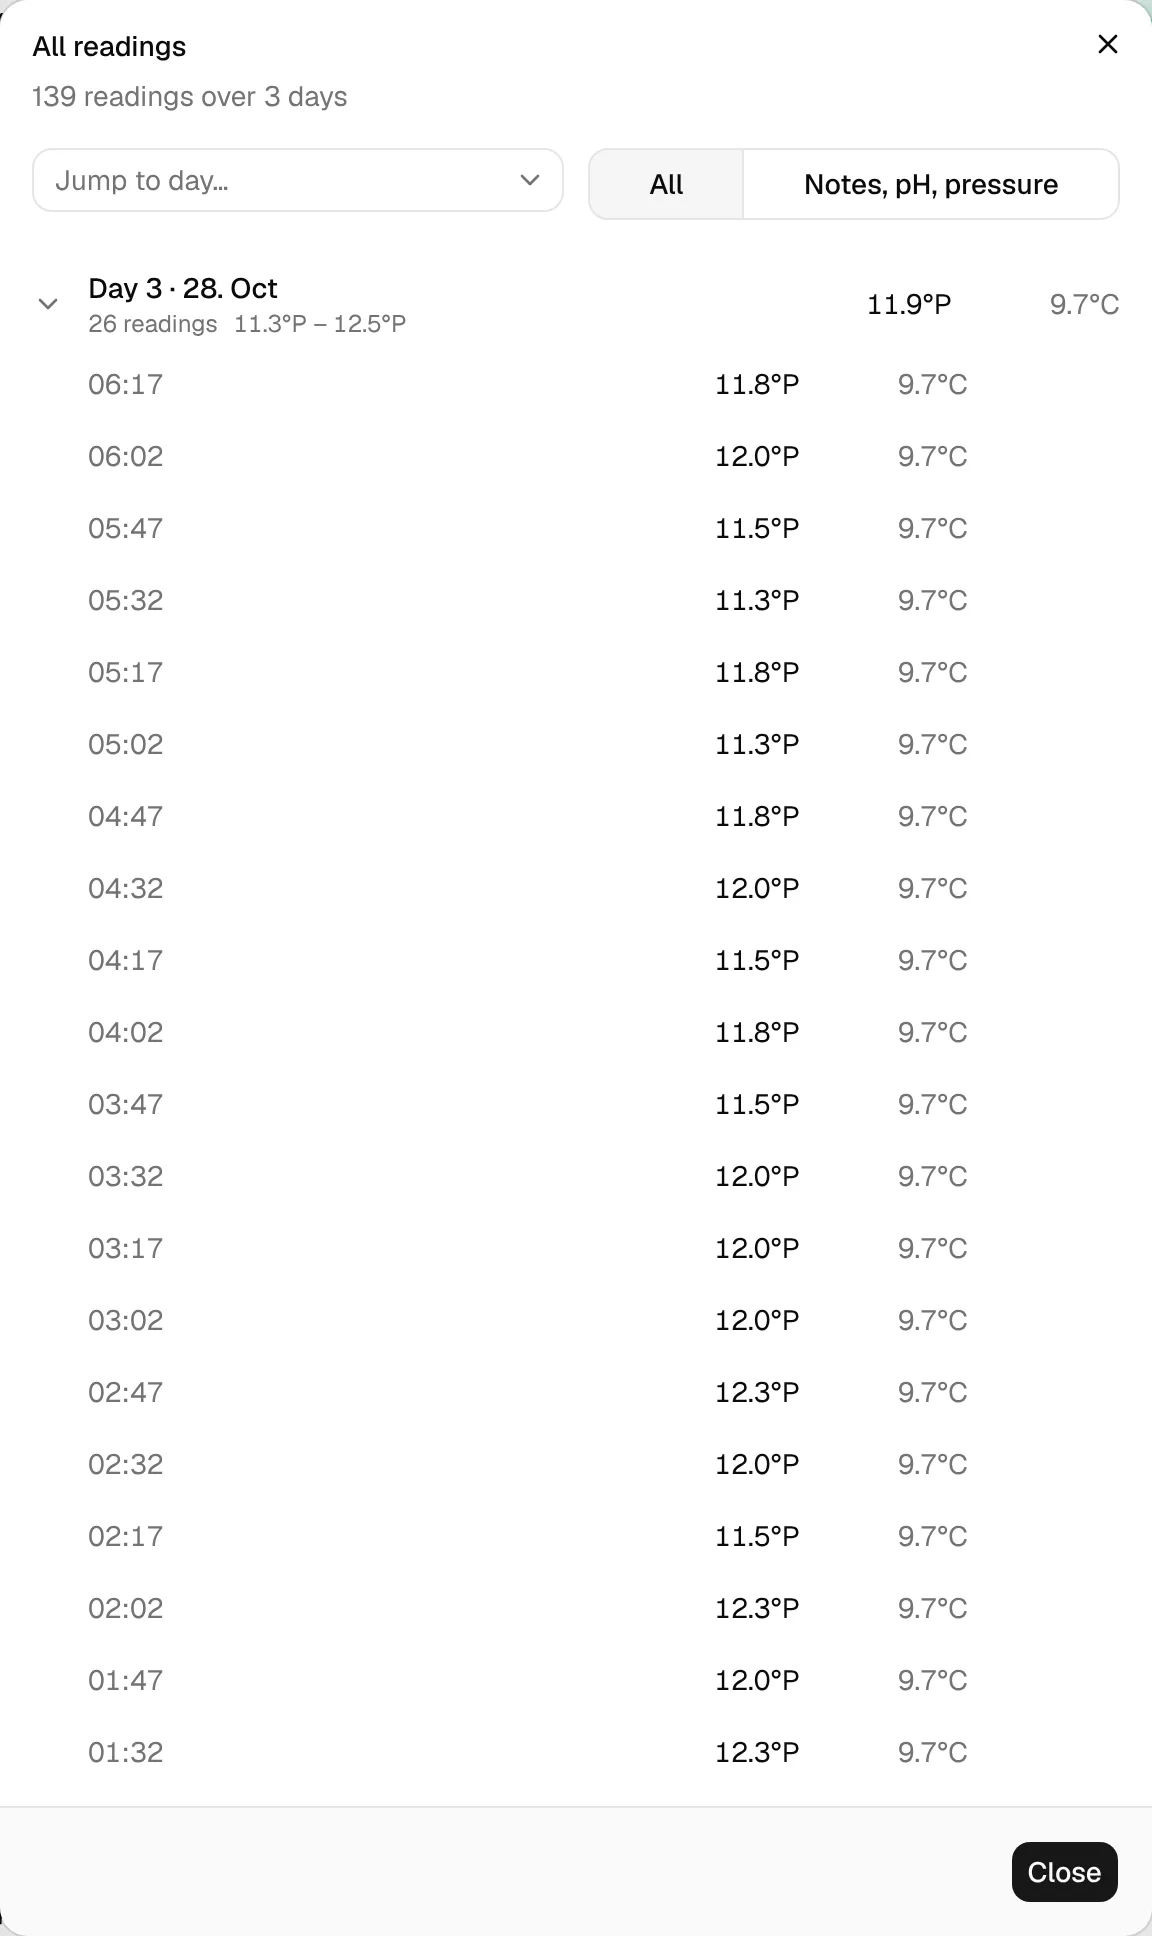
Below the chart, Latest shows the newest reading. Expand it for the four newest readings (click one to edit it) and daily averages. All readings opens every reading grouped by day, newest first, with each day's gravity range and averages. Jump to day… goes straight to a day, and the filter Notes, pH, pressure shows only the readings you typed in yourself.
Chart
The chart shows gravity (left axis) and temperature (right axis) from pitching to now. Switch layers on and off above it:
| Layer | Shows |
|---|---|
| Temperature | The measured temperature. |
| Speed | The fermentation speed on its own axis (right, purple). Only shown once there is a speed. |
| Plan | Your fermentation stages as bands with their planned temperature, including ramps, and upcoming events. Always on while there are fewer than two readings, so a new brew shows what to expect. |
| Targets | Lines for the OG, the target FG and, if a spunding stage is ahead, the gravity at which to close the spunding valve. |
| Projection | The projected gravity until the target FG, when there is enough data (see below). |
| Notes | A dot for every reading with a comment. |
Your layer choices are remembered for all brews. All, 3 days and 24 h set the time range; hover the chart for exact values. Device readings older than 12 hours are averaged in 2-hour steps so the curve stays readable; the last 12 hours show every reading.
Fermentation speed
The speed tells you how fast the gravity drops, per day, in your gravity unit: °P per day or SG points per day (1.050 → 1.045 is 5 points). The column Speed · 24 h shows the current value, with slowing once it is below half of the fastest speed so far and stable once the gravity has stopped moving. After fermentation (conditioning, archived) the column shows the Peak speed and its date instead. The expanded daily averages show how far the gravity dropped on each day.
From readings: speed = −slope of a straight line (least squares) through the gravity readings of the last 24 hours, per day. It needs at least three readings spanning 12 hours. Each point of the Speed line uses the 24 hours before it.
From your device: a RAPT Pill streaming from the RAPT portal sends its own "gravity velocity" with every reading. BrewForge shows that value instead and names the device next to it. A custom stream can send one too.
Manual readings: with fewer than three readings in 24 hours, the speed is the drop between your last two readings divided by the days between them, when they are 12 hours to 4 days apart ("since" the earlier one).
Example: 7.4 °P yesterday at 14:00, 6.1 °P today at 14:00, readings in between on a straight line → 1.3 °P per day.
Click How speed is calculated… in the expanded line for the readings behind the current value.
Final gravity
When the gravity has not changed for a day, BrewForge says Gravity stable for 24 h. and offers Record FG with the current value. other value… lets you type a different one. You can also use Set final gravity… in the section's ⋯ menu at any time. A recorded FG replaces the readings in ABV, attenuation and the recipe vs batch comparison, and clear removes it again.
Stable: at least two readings within the last 24 hours before the latest one, spanning at least 20 hours, that differ by no more than 0.001 SG.
Projection: a straight line fitted (least squares) through the gravity readings of the last 24 hours, extended to the target FG: hours = (current − target FG) / drop per hour. It needs at least 36 hours of readings and at least 10 readings in the last 24 hours, so in practice a connected device. It is hidden when the gravity isn't falling or the FG is more than 21 days away.
Next up
Next up lists the next five events of your fermentation schedule: temperature changes, stage starts, dry hops and the end of fermentation, with Today, Tomorrow or the number of days.
Spunding
If your schedule has a stage with spunding pressure, Next up also shows Close spunding valve at with the gravity to close the valve at and a forecast date. Click it for the Spunding Forecast: the gravity, the expected date, and under How it's calculated the planned FG, the gravity points needed to build the pressure and the safety margin.
The forecast needs the same data as the FG projection, and the latest reading must be at most 3 hours old. Otherwise the dialog says why it is unavailable. The trigger gravity also appears as a line on the chart.
trigger gravity = planned FG + (gravity points for the pressure + safety margin) / 1000
gravity points for the pressure = (CO₂ at stage pressure and temperature − CO₂ already in the beer) / 0.54
The safety margin is 4 points. Example: 15 psi at 10 °C means 2.3 volumes CO₂; beer at 10 °C already holds 1.2, so (2.3 − 1.2) / 0.54 = 2.0 points. With a planned FG of 1.014: 1.014 + (2.0 + 4) / 1000 = 1.020.
Carbonation
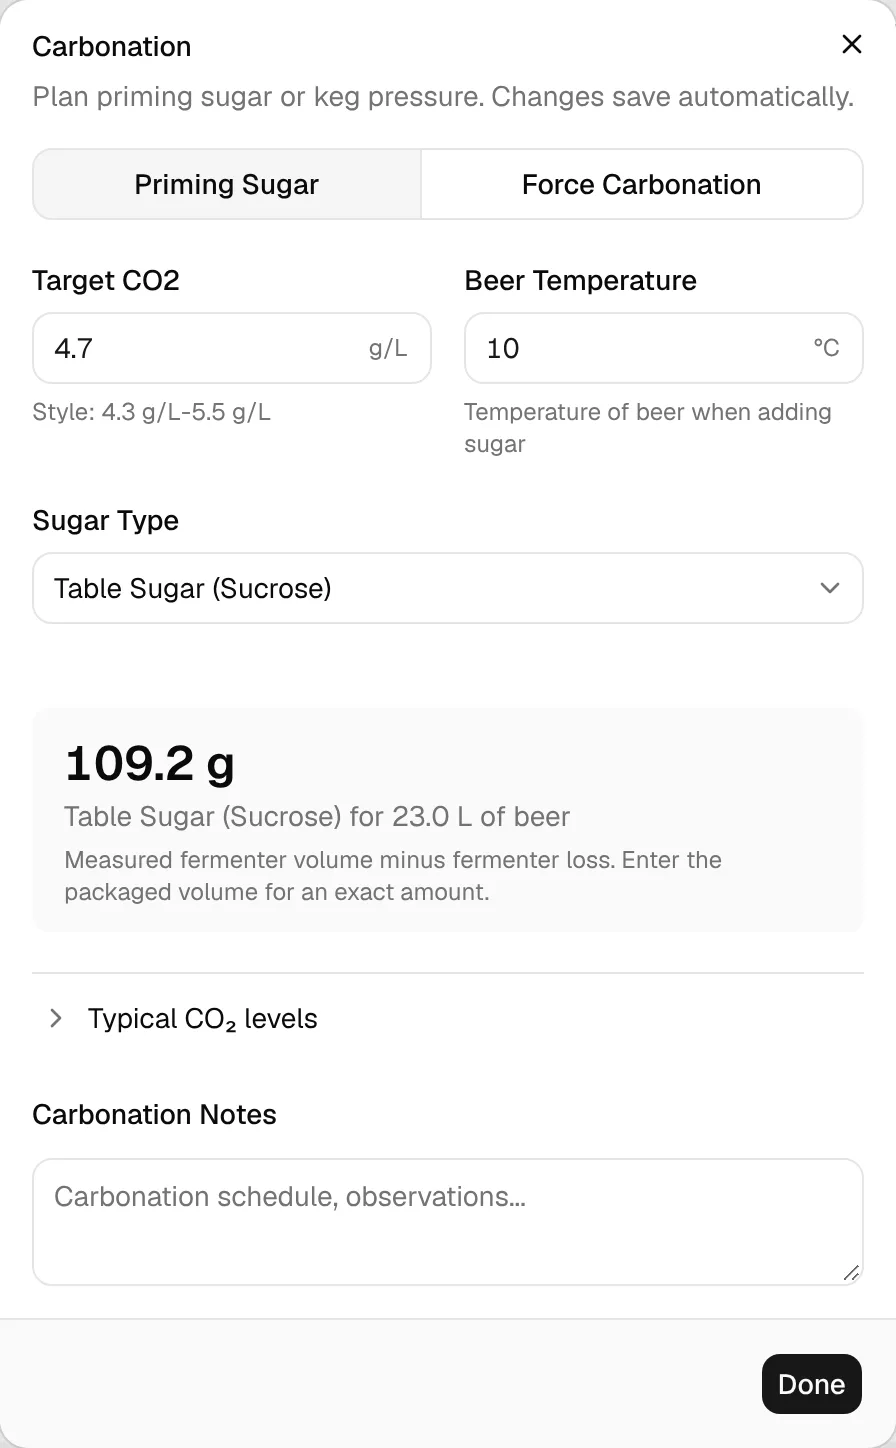
The Carbonation section holds your plan for priming sugar or keg pressure. Click Plan (or Edit). Changes save automatically.
- Target CO2: in your CO₂ unit (volumes or g/L). It defaults to the middle of your style's range (2.4 volumes if the style is unknown). Typical CO₂ levels lists ranges for ales, lagers, Belgian and wheat beers.
- Priming Sugar: choose the Sugar Type (table sugar, corn sugar, dry malt extract or honey) and the Beer Temperature. BrewForge shows the grams for the beer volume: the packaged volume once you entered it, else the measured fermenter volume minus fermenter loss, else the planned packaged volume. The beer temperature defaults to the peak fermentation temperature, because warmer beer has lost more CO₂.
- Force Carbonation: enter the Serving/Keg Temperature (default 4 °C) and BrewForge shows the regulator pressure. Temperature Reference lists the pressure for 0–12 °C.
The same formulas are on the carbonation calculator; see Brew calculations for details.
Conditioning
When the fermenting stages of your schedule are over, the tab asks Fermentation schedule is done. Move the brew to conditioning? Click Start conditioning, or change the status in the header. The brew moves to Conditioning and today becomes the conditioning start.
While conditioning, the Conditioning section shows the days left and a progress bar. Click Since … to set the actual start date if you moved the beer on another day, or Use date from fermentation schedule to go back to the planned one. The length comes from the recipe's conditioning days, or else from the conditioning stages of the schedule.
When the beer is ready, package it (see Results).
Print a fermentation log
Export → Fermentation log prints the yeast, planned and measured gravities, the fermentation plan and 16 empty rows for readings you take by hand. See PDF exports.